
2018 - One to Remember or Forget?
I have divided this newsletter into three parts, each equally important; 1) 2018 in review 2) Where do we go from here? 3) What guides us.
“Every past decline looks like an opportunity and every future decline looks like a risk.”
2018 in review.
I spent a lot of 2018 thinking, reading and writing about human psychology and how it applies to money, investing and the markets. This body of academics now has a name – behavioural finance – and has become mainstream since Richard Thaler won the Nobel Memorial Prize in Economic Sciences at the end of 2017 for showing how human nature and behaviour is predictably irrational and consistently defies economic theory.
In 2017 human nature was unchallenged by the markets. In 2018 human nature was prodded, provoked and pushed to the limit on what felt like an almost daily basis. In 2017 there wasn’t a single trading day in which the S&P 500 moved by more than 2% in either direction (and every single month was positive). In 2018 there were 20 such days. 2017 lulled us into a false sense of security. 2018 brought us back to reality.
That reality is that the long-term return of equities accrues only to those investors who can ride out the temporary declines. 2018 reminded us of the price of admission. We all know what we sign up to, but it doesn’t make it feel better, or easier in the moment.
2018 was the first negative year since 2008, and the tenth negative year in the last 39 (starting in 1980, ignoring dividends).
The S&P 500 fell 4.4% on a total return basis. The peak-to-trough drawdown, which occurred between September 20th and December 24th was 19.8% (on a price basis). This doesn’t quite hit the threshold of a bear market which is defined as a 20% fall, but goodness me, it’s near enough.
The S&P 500 is a measure of large companies in the US. Smaller companies fared worse, with the Russell 2000 falling 27% peak-to-trough before bouncing off the lows at the end of the year.
Emerging markets and Europe followed a similar path, with most entering an official bear market.
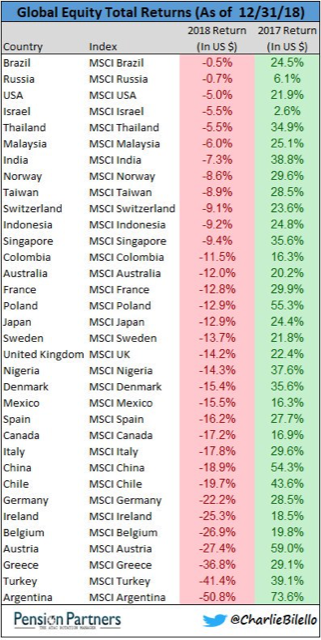
There were only three country ETFs that ended up in 2018 – Qatar, Saudi Arabia and New Zealand.
Many would say 2018 was a year to forget, but we need years like this. Here is what 2018 taught us:
Markets can go up in a hurry and down in a hurry. 2018 saw the S&P 500 hit an all-time high of 2940 on 21st September, which put the index up around 10% for the year at that point. It then quickly fell close to 20% before bouncing off the lows in the last week of the year (the market rose 5% on Boxing Day).
The speed of the fall has left many saying the markets have gone crazy and that algorithms (computer models) are to blame for the increase in volatility. The data doesn’t support this assertion.
The chart below shows the rolling 30-day standard deviation of the S&P 500 going back to the late 1920s. Volatility is a feature, not a bug. The reason that owning companies is so rewarding over the long-term when compared to cash or bonds is that they can suddenly fall 20% without warning.

We had extreme volatility in markets long before we had computers. Human emotions create volatility and if there is one thing that we know, it’s that markets will continue to be volatile so long as we are on this planet.
“In general, I am not especially moved by claims that algorithmic trading creates inscrutable volatility. Long before algorithmic trading, markets were volatile, and humans have always been notably terrible at explaining why markets move even when the humans were the only ones doing the moving. My general view is that market moves are emergent properties of many humans acting on their individual beliefs and desires, and that computers are tools that allow the markets to do what they were going to do anyway, but faster.”
Keep it simple and understand what you own. There were a couple of stories in 2018 that were a real reminder of why we keep things simple. At the end of January and beginning of February, the S&P 500 fell around 10% in a few weeks. Investors in the VelocityShares Daily Inverse VIX Short-Term ETN (ETN not ETF), a note issued by CreditSuisse, saw the value of their investment fall 95% (a ‘termination event’) overnight (it had returned 81% in 2016 and 188% in 2017). The prospectus contained the following warning:
“Upon such an event, your ETNs would be subject to acceleration and you will likely lose all or a substantial portion of your investment. The long term expected value of your ETNs is zero. If you hold your ETNs as a long term investment, it is likely that you will lose all or a substantial portion of your investment.”
I don’t suppose many investors read the prospectus.
Another story that caught my eye was a hedge fund managed by a chap named James Cordier that specialised in writing commodity options for high net-worth investors. It similarly went bust overnight after extreme movements in energy markets. You can watch his appallingly misjudged video message to investors here. Not only were his investors wiped out, they actually now owe money to the funds’ brokerage firm because Cordier had borrowed on margin against the accounts.
These things work until they don’t.
We must focus on our own time horizon. One of the reasons that the markets can be so hard to navigate is that there are millions of participants, all with different goals and time horizons, operating in the same pool. At one end you have day traders who have no interest in what has happened in the last year or what might happen in the next. They only care about the price of the thing they own and whether the price will be higher or lower in three hours. At the other end you have the average retiree who has a time horizon of several decades. The strategy a day trader is following may be perfect for his/her goal but would be totally inappropriate for the average long-term investor focused on retirement.
The problem is that they are all being fed the same information. They are all getting hit by the same waves because they are all swimming in the same pool. It is easy to get confused and end up making decisions based on someone else’s time scale because the information that is important to them suddenly seems important to you.
Morgan Housel recently wrote about this:
“Things get crazy when the actions of long-term investors playing one game become influenced by the actions of short-term investors who are playing a different game and appear to know something the long-termers don’t. The long-termers usually don’t realize this, which is why the process is both innocent and bewildering, even in hindsight.”
In a podcast, Jason Zweig, said that “maintaining a long-term horizon is harder than it ever was, and it was never easy”.
Patience and discipline are the only things that matter in this game. We will not achieve our long-term goals if we are impatient and undisciplined. We are in a marathon and not a sprint.
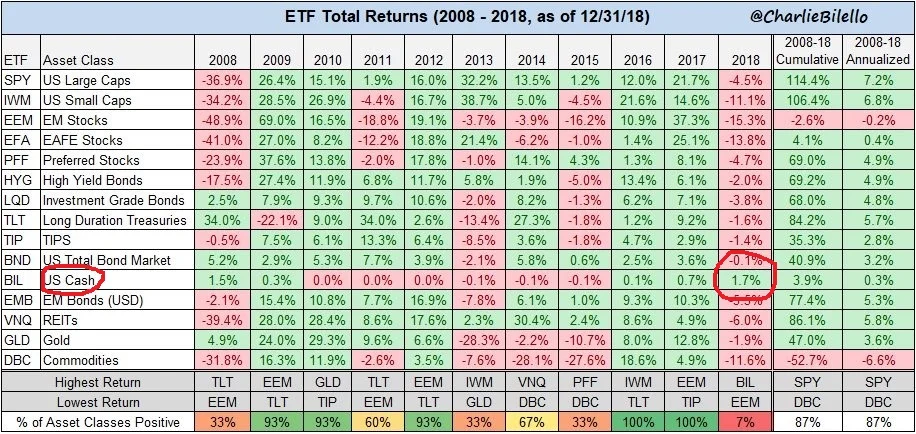
Sometimes, just sometimes, temporarily, cash is king. 2018 was the first year in recent history where the overwhelming majority of asset classes were down (see chart below). Temporarily, the term ‘cash is king’ rang true. Over the long-term of course we know cash is a horrible and risky investment – it is the least likely to give you a return after inflation and therefore maintain your purchasing power. But years like this are a reminder to us that maintaining a good cash buffer as a margin of safety is always wise.
“Cash is a bad investment over time. But you always want to have enough so that nobody else can determine your future essentially.”
Where do we go from here?
“While we never know where we’re going, we ought to know where we are.”
I have written in the past about how making predictions is an exercise in futility. I have no idea what will happen in the markets this year, and neither does anyone else. But Howard Marks is right, we need to have a sense of the environment we find ourselves in.
One way to understand market cycles is to understand valuations, that is how cheap or expensive stocks and other assets are.
According to Charlie Bilello at Pension Partners, the P/E ratio (price to earnings ratio – a measure of value) of the S&P 500 fell 25% in 2018.
The P/E ratio is the price of the S&P 500 divided by the aggregate earnings of the companies in the index. The P/E ratio can fall as the top of the fraction (the numerator) falls or as the bottom of the fraction (the denominator) rises. This year we have had a double whammy - price down in combination with earnings up. The earnings of the largest 500 companies in the US has increased by over 26% over the last year.
The P/E ratio of the market is now less than 16 which is below the 25-year average. This is a very positive thing for markets going into this year. Valuation is a terrible timing tool in that it doesn’t tell us anything about what markets are going to do in the short-term. However, over the longer-term when markets are cheap future returns tend to be higher, and when markets are expensive future returns tend to be lower.
Taking out all the jargon from the above and we say this, simply. The thing we are wanting to buy is 25% cheaper than it was last year. Think about walking into your favourite store and seeing all your favourite things marked down 25%. Assuming you had cash to spend, what would you do?
“This is the one thing I can never understand. To refer to a personal taste of mine, I’m going to be buying hamburgers the rest of my life. When hamburgers go down in price, we sing the ‘Hallelujah Chorus’ in the Buffett household. When hamburgers go up, we weep. For most people, it’s the same way with everything in life they will be buying – except stocks. When stocks go down and you can get more for your money, people don’t like them anymore.”
Most of the pain in the markets happened in the last quarter of the year – the S&P 500 fell 14% in those last three months. Ben Carlson recently looked at subsequent one, three- and five-year performance of the S&P 500 after the worst quarterly performance going back to 1926. The table below shows the results of his analysis, excluding the period of the Great Depression (I am assuming that we are not going into another Great Depression – a fair assumption I think).
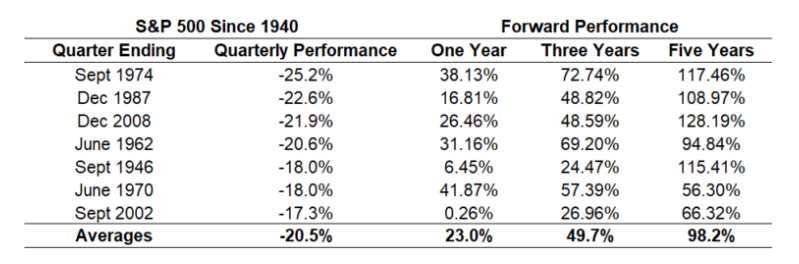
Source: Ben Carlson
Of course this doesn’t tell us what will happen this time around, but as the old adage goes, to know where you are going, you must know where you have been. Understanding market history and analysing the data is a good way to move from being an emotional, short-term investor into being a rational, long-term investor.
““Using history as a guide…” requires a disclaimer because no two market environments are ever exactly the same. Memories shape how market participants think, react, and feel about the markets. So there’s no way of telling what will happen next even when we use scenario analysis to guide our actions. What I do know is the history of stock market performance shows that the longer you extend your time horizon, the higher the probability you have of seeing gains. This relationship seems to hold following a big down quarter in stocks, as well. I’m not positive this will happen again because nothing is ever guaranteed but expected returns have likely risen from where they were just 3 months ago.”
The only prediction I am willing to make about the future is that what we are experiencing today will pass and when we look back it will barely be visible on this chart (note the logarithmic scale):

“This too shall pass.”
What guides us.
It is important to restate my overall philosophy of investment advice, particularly in the context of a difficult year:
(1) The performance of a portfolio relative to some arbitrary benchmark is not what matters.
(2) The only benchmark we should care about is the one that indicates whether you are on track to achieve your financial goals (for most of you, this is to retire and maintain your lifestyle, dignity and freedom).
(3) We measure risk as the probability that you won’t achieve your goals.
(4) Your portfolio should be invested in the asset class(es) that minimizes that risk.
“Volatility and risk are two terms that should not be used interchangeably for most investors, because the real risk is not a fluctuating account value. The real risk is arriving at some later point in time and discovering that you haven’t saved enough or taken enough risk to lead the lifestyle you’d hoped for (aka running out of money at a time in life where you can’t replace it with new income).”
Goal-focused investing is the recipe for long-term financial success. This recipe doesn’t change when the market changes. In a world of unlimited information our edge is patience and discipline. We are not in a hurry. All good things take time.
“Weigh the evidence as it comes, invest based on probabilities, be forever humble and thankful, and leave the predictions to those whose job it is to entertain. That’s the best you can do in this business.”
Dear clients, thank you for the trust you place in me. If this newsletter has raised any questions, please don’t hesitate to call me. That’s what I am here for.
georgie@libertywealth.ky